A look back at 2021 hotel trends and statistics and questions for the new year
We recently returned from ALIS (Americas Lodging Investment Summit), the largest and most widely-attended hotel industry conference of the year. This year’s ALIS was the first regularly scheduled version of the event since January 2020. ALIS is held in late January each year in downtown LA, and in many ways the Conference marks the start of the new year for hotel owners. Attendees spend two days racing from one meeting to the next discussing potential investment opportunities, and brokers hand out stacks of glossy brochures filled with enticing color-enhanced pictures of hotels that are newly for sale.
While the glossy brochures were still very much present this year (and the pictures still looked great), there were some differences between this year’s conference and the January 2020 conference. Notably, attendance this year was probably ~60% of pre-COVID levels. But attendance was much higher than we expected given the Omicron variant, and nearly all of the major owners, lenders, and brokers attended the conference signaling to us a “back to business” mentality.
After the conference, hotel research analysts published their conference themes and take-aways, which were largely confirmations of the predictions and observations we made in our prior quarterly updates. Namely: leisure demand for 2021 ended up being very strong, owners are now increasingly bullish on the recovery in group business, corporate demand is lagging but starting to show signs of life, “bleisure” travel is expected to continue to grow with the persistence of more flexible work structures, and U.S. sector-wide RevPAR is projected to fully recover to 2019 levels in late 2022.
Notably missing from analysts’ conference reports was what we viewed as the biggest theme of this year’s conference: “being together”. As the first regularly scheduled and attended hotel conference since the onset of the pandemic, this year’s ALIS Conference was the first time in two years that the majority of hotel owners were gathered together. Indeed, the most popular refrain we heard echoing throughout the conference venue was “it’s so good to actually see you in person!” People were genuinely excited to finally break away from Zoom, and be together in person. Even people who don’t identify as “conference people” seemed to be really excited to be at this year’s conference.
Prior to the pandemic, “time” was often cited as the greatest luxury in life. The pandemic, more than any other event in recent history, has forced people to consider how they want to spend their time. “Being together” has bubbled to the top of the list. This intensified desire (if not need) for “being together” was a principal driver of record-breaking hotel leisure demand in 2021, as people traveled to reunite with families and friends. And we believe this desire, amplified by a shift to more flexible work structures, will be one of the pandemic’s most lasting impacts on demand for travel and experiential hospitality sectors. But not all themes that have governed recent hotel demand are here to stay. The next few years will mark the next phase of the post-pandemic investment period: a churning rotation out of the blur of the pandemic and into whatever the NEW new normal will be. A period we’re calling the Great Normalization.
The Great Normalization will be anything but normal. The challenge / opportunity for hotel operators will be to figure out how to adapt hotel operating models to meet shifting demand trends. And the challenge / opportunity for hotel owners will be to navigate these evolving operating models against a very dynamic backdrop that will include not only hotel sector-specific forces but also a host of macro and exogenous factors.
We believe one thing is for sure: the most prominent characteristic of the Great Normalization period will be messy short-term hotel performance data that will cause valuation inefficiencies across the hotel sector, a point we delve into further below. When the dust (and performance data) finally settles, though, the best owners will be those that avoided being hypnotized by the glossy brochure pictures and momentum bets, and instead focused on the basics: leveraging both real-time and long-term data and operational insights; developing thematic views on “where the puck is going”; and taking a disciplined, patient, and targeted approach to selecting attractive investments. After all, a picture might be worth a thousand words, but “I’m a great investment” might not be among them.
A Quick Look at 2021 Hotel Sector Statistics
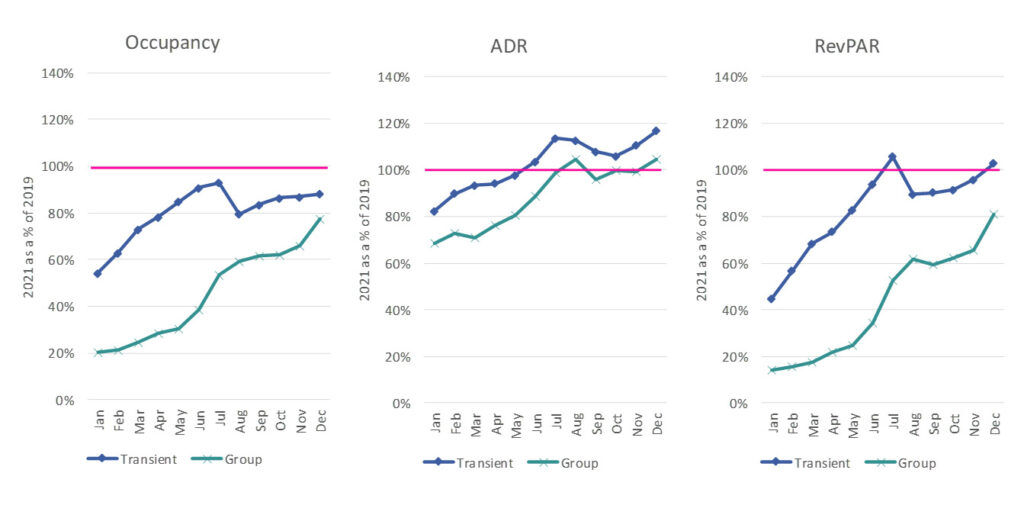
Occupancy for luxury and upper upscale hotels (across the U.S., and including urban and resort hotels) finished 2021 at 50.5% vs. 72.1% in 2019. Unsurprisingly, the second half of the year fared much better than the first half of the year: occupancy in the second half of the year was back to ~80% of 2019 levels and nightly rates were ~9% higher than during the same period in 2019. Of particular note, sector-wide RevPAR in December 2021 was 98% of the 2019 level, as the holiday travel window widened and travel to cities saw a pronounced uptick despite the Omicron variant.[1]
In terms of demand segmentation, the Transient segment drove performance for the year. Transient RevPAR hovered around 90%-100% of 2019 RevPAR in the second half of the year, remarkable given the lack of corporate transient demand (it was basically all leisure-driven). ADR growth was strong, with leisure-oriented hotels aggressively pushing rate and guests paying the higher rates. Group showed a strong finish to the year.1
U.S. nationwide hotel construction spending finished 2021 down ~50% from the prior peak in 2018, representing a material pull-back in supply growth that is expected to last in the near-term. From Newmark’s hotel team: “Hotel development has slowed in many markets…with costs up 25-30% compared to pre-COVID levels and a challenging financing market, countless projects have stalled or been shelved entirely.”[2] As many of you know, we were bullish on the supply dynamics for complex full-service hotels prior to the pandemic given the high costs, long timelines, and capital-funding challenges to get them built. We are even more optimistic now, and believe that supply will be constrained for the foreseeable future, benefitting existing hotel properties.
Total U.S. hotel transaction volume in 2021 was $36.0 billion, 6.9% higher than 2019 levels. The higher transaction volume was partly driven by select service hotel sales, which represented ~43% of the total transaction volume and reached an all-time high of $15.3 billion in total transaction volume (up ~5.5% over the 2019 prior peak). The demand to acquire leisure hotels in the second half of the year was also a big contributor to the strong volume. All eyes seemed to be on the U.S. sunbelt with transaction volume in that region up ~25% over its 2019 level. Conversely, transaction volume in the northeast U.S. was down 37%, as urban markets remained out of favor with prospective buyers.[3]
An Introduction to the “Great Normalization”
Broadly speaking, we see the major factors shaping the Great Normalization period falling into three categories: (1) Operating Performance, (2) Inflation, Interest Rates, and The Federal Reserve, and (3) Other Macro Stuff. In this letter we will highlight some observations in the first category, Operating Performance. We’ll cover the other two categories in upcoming notes / letters, along with additional aspects of the Operating Performance category.
Operating Performance
As discussed above, the most prominent characteristic of the Great Normalization period will be messy data. The year 2021 didn’t disappoint in this respect, and in this section we’ll take a closer look at what’s been happening with short-term data at “pure leisure” hotels, hotels that derive the overwhelming majority of their business from leisure demand.
In prior letters and above, we have noted that Transient hotel performance in 2021 was very strong. The confluence of several factors drove significant demand at U.S. leisure-oriented hotels: (1) pent-up demand for vacations, (2) companies delaying return-to-office dates, (3) kids being out of school, (4) material increases in U.S. household net worth, and (5) Americans largely being confined within U.S. borders and unable to travel to international destinations. People flocked to beaches, mountains, and golf courses, and “drive-to leisure” became a buzz phrase in the hotel sector (even though a lot of travelers actually took cheap flights).
We analyzed a range of custom data sets to put the strong Transient demand into better context. We found that from April 2021 to September 2021 pure leisure hotels saw Transient RevPARs run at 130%-170% of 2019 levels.[4] Most of the gain was ADR-driven, with guests paying ~40%-60% higher nightly rates than they did during the same time in 2019. So, for a hotel that would typically charge $300 per night, nightly rates shot up to $450 or more (plus taxes and resort fees charged as a % of the higher nightly rate).
Hotels in South Florida were a big driver of the RevPAR outperformance. Notably, we analyzed a subset of leisure hotels in South Florida and found they achieved RevPAR in June 2021 that was nearly double the RevPAR achieved in June 2019. It’s worth pointing out that June (and the summertime in general) has historically been the off-season in Florida because of hot muggy weather and hurricanes, and off-season RevPAR is typically half of RevPAR during the on-season winter months.
Leisure hotels were achieving these record-breaking nightly rates / RevPARs in 2021 at the same time they were short-staffed. At the onset of the pandemic, practically every hotel in the U.S. laid off or lost staff. By spring 2021, hotels had begun to hire back staff, but staffing levels were still significantly below pre-COVID levels. Looking at a sample of U.S. leisure hotels we found that the number of employees (measured as FTEs) was ~60%-80% of pre-COVID levels for 2021, and Total Revenue per FTE (i.e. revenue generated per employee) for 2021 was ~20%-40% higher than in 2019. Some of the missing employees were likely tied to the lack of group business and the challenging hiring market. But a lot of the missing employees were a function of hotels running a lot leaner operating models and capitalizing on the fact that guests were willing to pay materially higher nightly rates while accepting a lower level of service – guests were just happy to be on vacation.
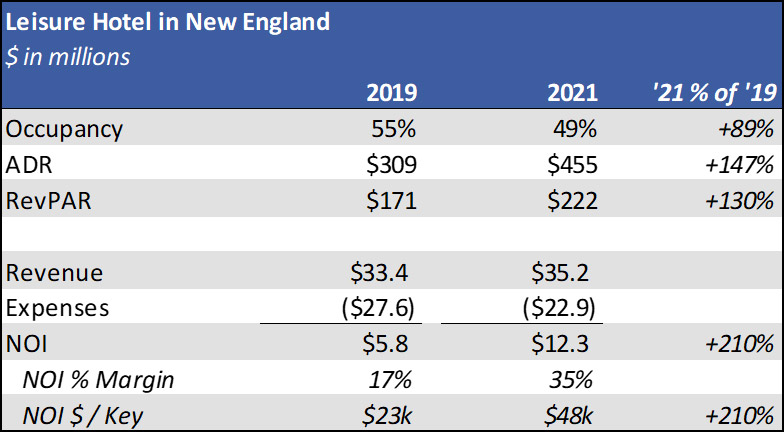
As a result of these dynamics, hotel profit margins ran at extraordinarily high levels throughout much of 2021, and NOI $ / Key for some of these pure leisure hotels doubled or even tripled in 2021 off of already stabilized 2019 NOI. This impact is especially pronounced in smaller-sized hotels (up to ~200 rooms). Here are a few examples:
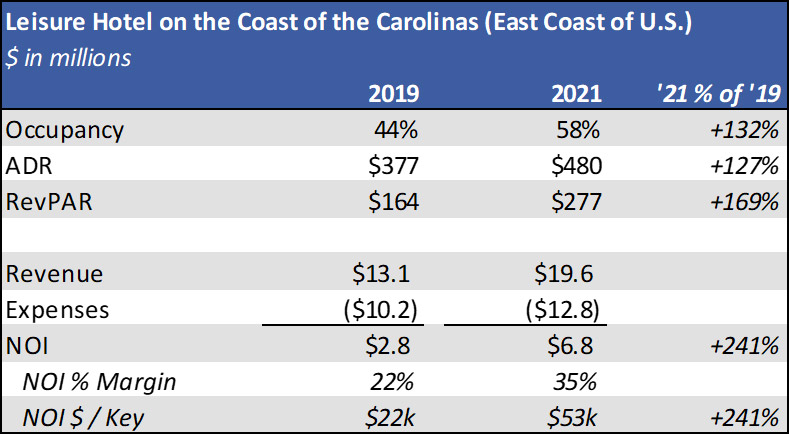

In the case of the very first hotel above, it’s worth pointing out that NOI averaged ~$25k per key pretty consistently for the six years prior to COVID. The one other time the hotel’s NOI “spiked” was from 2016-2017 when NOI increased to ~$30k per key, and that was partly due to the Zika virus. While the impact to larger hotels was not as dramatic as the examples above, the effect was still felt, especially in markets like Florida.
As 2021 progressed, owners and brokers started marketing these pure leisure hotels for sale at valuations that assumed this type of performance was largely sustainable. Many of the hotels found buyers, especially as cross-over (“tourist”) buyers started to chase the drive-to leisure buzz (the “momentum bet” we alluded to earlier in the letter). These tourist investors generally lack the historical context and operating perspective to fully understand why certain NOI $ / Key levels are unsustainable or what a normalized staffing structure looks like. Several U.S. markets, including the Florida Keys, Charleston, Big Sur, New England, California wine country, and Puerto Rico, saw new records set for valuations on a per key basis.
To be clear, it is not a bad thing for leisure-oriented hotel performance to have benefitted from these dynamics. Leisure travelers’ resilience and willingness to pay a premium rate is a key reason for our historical focus on leisure-oriented urban and resort properties. And the anticipated strength of leisure demand coming out of lockdowns was also a key reason we bought the hotels we did. Additionally, the strong leisure demand in 2021 was certainly a contributing factor to our properties handily beating our underwritten expectations in 2021 and heading into 2022. The point, however, is that in the absence of an investment strategy / business plan that also includes meaningful value creation (e.g., fixing operations, pursuing ROI capex projects), a hotel’s performance is solely reliant on beta, and performance is highly susceptible to a hard correction as the market churns and normalizes. Buyers who pay significant premiums for hotels based on the expectation that these dynamics are largely sustainable will almost certainly be severely disappointed.
So how do you know whether a hotel’s performance is beta-driven or alpha-driven? We’ll cover that topic in our next quarterly letter.
It’s difficult to say how operating performance for these types of assets will normalize or when, and precisely what the NEW new normal will look like. We find ourselves asking “how many things need to go right for some of these pure leisure hotels to sustain their 2021 performance or to justify their recent sale prices?” Will travelers permanently abandon seasonal travel patterns that existed long before COVID (e.g. avoiding destinations because hot muggy weather and hurricanes aren’t ideal)? How will post-COVID wealth effects hold up when the Federal Reserve withdraws liquidity from the financial system and increases interest rates? What happens when companies finally return to some type of in-person work model? What happens when everyone can travel to Europe or other international destinations? And does improving pricing power for the airlines and/or an increase in oil prices take share of wallet away from certain hotels charging record-high nightly rates? The answers to these questions will reveal themselves in the next couple of years.
We’re not trying to sound overly pessimistic. As we mentioned at the beginning of the letter and in prior letters, we do see certain themes causing permanent shifts in demand and profitability across various sub-types of hospitality properties. We don’t see a permanent doubling or tripling of NOI productivity, though, and we believe that a reset could come sooner than some folks expect.
Fortunately for us, these likely temporary swings in valuations also create opportunities. Don’t be surprised if one of our quarterly letters 2-3 years from now includes a note that we acquired a distressed debt position on an over-leveraged pure leisure hotel. Also, fortunately for us, there are plenty of other pockets of inefficiency and distress throughout the hotel sector right now where data is just as messy and acquisition basis looks very attractive (like in parts of New York City, as we discuss further below). The tourist investors haven’t found those opportunities yet, but they will eventually – probably in a glossy brochure, at a conference in downtown LA.
Please refer to disclaimers for important considerations.
[1] Source: STR. Data refers to Luxury and Upper Upscale classes of hotels throughout the U.S.
[2] Source: U.S. Census Bureau, Newmark Lodging Capital Markets Team.
[3] Source: Real Capital Analytics.
[4] Source: STR. Data based on 159 luxury class hotels in the Lower 48 states of the U.S. representing ~40k hotel rooms. The largest geographic concentrations of properties in the data set were Florida, California, Arizona, and Colorado.