The “new normal” – examining the shift in market dynamics, travel trends and more
It seems like things are slowly starting to “get back to normal” in the U.S., albeit somewhat unevenly and with plenty of uncertainty about variants and what a post-pandemic “normal” really looks like. There have also been some very interesting shifts in people’s lifestyles and consumption patterns, and it remains to be seen which of these shifts are permanent and which are temporary. We, like many of you, are busy looking for clues.
As hotel investment geeks, we have always found it an interesting sector. But it’s a particularly interesting space to be in right now. Through our hotel lens we’re able to see many facets of people’s lives and herd behaviors – how they vacation, how they gather for social events (e.g., weddings, bat mitzvahs, family reunions) and corporate outings (e.g. company retreats), how they travel for business, and how they dine out and party. And we often get a glimpse of these behaviors through leading indicators – forward bookings and reservations, the length of booking windows, forward pricing data, meeting planner site visits / property tours, and cover and average check data at our restaurants and bars (to name a few).
Before the world shut down in March 2020, we were able to see the leading edge of what became a wave of travel cancellations. As the world sat in suspended animation, we were able to see the leading edge of strengthening leisure demand. And as the world reopens, we are starting to see the leading edge of what we believe is a recovery in group and business travel that would solidify the broader hotel market’s recovery. It goes without saying that there are still a lot of vaccine shots that need to get administered and variants we need to monitor. The Delta variant (and potentially other variants) will create a bumpy ride to achieving escape velocity. And as anyone who has followed our COVID letter series will know, we don’t take anything for granted in our space – rather we take a very sober and conservative outlook when developing our investment themes and making our projections. But the data we’re seeing now, which we elaborate on more below, is pointing to a strong summer 2021 for leisure travel as folks make up for a “lost year”. And we believe we will see the next leg up in the recovery after Labor Day as most kids likely return to school and most offices reach the next phase of reopening.
There are many things on our minds at any given time, but in an attempt to keep these updates shorter and more digestible we try to zoom in on a couple of themes in any given update. In this quarter’s update, we will take a very quick look at last quarter’s market activity and current trends for group and business travel.
Quarterly Market Update
Performance Trends
Travel indicators continued to recover through the 2nd quarter of 2021. U.S. airline passenger volumes finished June just -17% below volumes for the same period in 2019, compared with volumes being -60% below 2019 levels throughout much of the first quarter. Bank of America internal credit card data shows that spending on lodging is now approximately equal to 2019 levels, a remarkable achievement given that the recovery has been almost entirely driven by leisure travel, with the recovery in group and business travel lagging. The same Bank of America data shows spending at restaurants and bars performing even better with spending up approximately 20% over 2019 levels – again, a remarkable achievement in light of closures and hiring challenges. Unsurprisingly, leisure destinations continue to garner the overwhelming majority of hotel demand. Urban markets continue to lag, but are beginning to see a notable increase in demand for hotels and restaurants / bars.
As an indication of the rapidly evolving environment for hotel demand, we can look at performance from a sample of leisure-oriented hotels. A big caveat here is that this sample portfolio is largely weighted towards leisure and group travel, and business travel makes up only a small part of direct demand. Urban hotels are clear laggards in the recovery right now, as they are more dependent on business travel, and so are not experiencing the recovery in performance to the same degree.
Many organizations started the year with what they believed were realistic budgets across properties.. For the subset portfolio, the 2021 budget showed: 45% occupancy vs. 71% occupancy in 2019 and NOI that was 32% of 2019 levels. In the most recent reforecast[1], occupancy for 2021 was revised upward to 46% and reforecast NOI now stands at 50% of 2019 levels. The increased NOI in the latest reforecast equates to a 56% increase vs. original budget.
The improved outlook is being driven by an array of factors: stronger-than-expected leisure demand, improving group demand (see more below), better nightly rates, better on-property spending, and very strong expense management.
These reforecasts will continue to evolve, especially as travelers digest news on the Delta variant. And we are taking a cautious approach to refining these reforecasts with our on-property teams each month. We’re also cautious in how we are underwriting new opportunities, and have not been projecting 2021 NOI to achieve 50% of 2019 levels. But directionally speaking, the data is starting to show a quicker-than-expected recovery for hotels.
Interestingly, as the hotel industry has enjoyed an uptick in demand during the 2nd quarter, we have seen historical seasonality patterns thrown out the window – leisure destinations that have historically seen a decline in demand during the summer (e.g., Mexico, ski destinations) are experiencing very strong summer bookings. The booking window is also very short, with many people seemingly booking trips on very short notice or delaying travel decisions until they see additional information on destinations (e.g. should they risk traveling to Europe?). We expect most of these seasonality trends to normalize in 2022 and beyond, but possibly with some residual effects as travelers perhaps think more flexibly about when they are willing to travel to certain destinations. This dynamic could have a positive impact on historically seasonal leisure properties.
Transaction Activity and Debt Capital Markets
The transaction market continued to heat up throughout the second quarter as well. In the first quarter of 2021, there were only 2 hotel transactions greater than $100mm in value and no transactions greater than $200mm in value. In the second quarter (through July 16th) there were 15 transactions greater than $100mm and 6 transactions greater than $200mm. The 6 transactions greater than $200mm totaled $1.9bn in total transaction value, and included Ohana’s acquisitions of the La Cantera Resort in San Antonio, TX and the Hyatt Regency Lost Pines resort in Austin, TX.
The 2nd quarter saw 4 transactions trade for $1mm per key or higher (the one transaction excluded from the list below was the Ventana Inn Big Sur, which sold for $148mm and $2.5mm / key to Hyatt Hotels & Resorts). There was a clear focus on leisure-oriented assets in the recent spate of transactions, but we also began to see smaller transactions in urban markets such as New York City and San Francisco. And we expect to see additional activity in urban markets headed into the 3rd quarter.
Hotel debt capital markets continued to improve throughout the 2nd quarter as well. Record-low yields globally combined with improving sentiment for a hotel recovery drove notable improvements in terms for borrowers. We estimate that interest rates for hotel acquisition loans have come in approximately 200bps from nine months ago – from ~6.5% interest coupon for a 70% LTV loan last fall to a ~4.5% interest coupon currently – and structural terms have also improved markedly. The market for hotel refinancings (vs. acquisition financings) is beginning to follow suit, although many borrowers are still finding it challenging to obtain the same debt proceeds as lenders generally want to see fresh equity come into a deal.
The improvement in the hotel debt financing market has been helped by an uptick in the number and variety of participants. Last fall, a handful of private debt funds were the only active lenders in the space. The 2nd quarter saw a number of banks and balance sheet lenders re-enter the market. And securitized markets (CMBS, CLO) are opening up for hotel loans as well.
We expect to see further increases in transaction activity in the 3rd and 4th quarters, and we maintain our view that the most interesting opportunities will be driven by the steady flow of hard loan maturities and borrowers needing to refinance, recapitalize, or sell their properties. We are also seeing a number of “zombie” capital stacks where lenders and borrowers are at a standstill, loans have matured or are about to mature, and there’s no roadmap for a clean exit. In these instances, lenders have been hesitant to call defaults and the parties have resorted to hoping a rapid recovery in performance would fix their problems.
Quick Look at Group and Business Travel Demand
As described earlier in the introduction to this update, hotels provide a glimpse into people’s lives and herd behaviors. In the hotel space, these herd behaviors are tracked through three key customer segments – Leisure Transient (vacationers), Corporate Transient (aka “Business Travel” or “BT”), and Group (companies, associations, conferences – generally bookings of 10 rooms or more). There are many ways to further stratify these segments and group customers, but these are the three key segments the industry watches at a very high level.
We estimate that Pre-COVID the U.S. full-service hotel space derived 25% of room nights from Leisure Transient guests, 40% from Business Travelers, and 35% from Groups. These % contributions vary by property, and change daily for any given hotel (which, as a side note, is why dynamic revenue management is such an important competency in the hotel space).
The segments are also interdependent – for example, because a hotel has a hard constraint on available rooms in a given night, filling up more of your rooms with attractive group occupancy can create a scarcity of available rooms for leisure travelers. And that scarcity or lower supply of leisure rooms can allow you to “yield” or charge higher nightly rates to your leisure guests (finding the right mix and balance on any given night is what determines whether you’re maximizing your profit for that day).
Having insights into what the recovery in group and business travel looks like and how it might unfold can help us better analyze opportunities as well as develop new investment themes. As usual, we like to combine real-time data with contextual insights to start to piece together a view. For contextual insights, here is some real-time commentary on group and business travel from our property teams:
- Director of Sales & Marketing: “A few comments on the group sales activity in June: the number of group sales leads doubled [with] 75% of the lead volume…for 2021 programs. The number of group bookings increased 33%. Corporate and entertainment segments are rebounding.”
- Director of Sales & Marketing: “We have seen an increase in our group sales inquiries. Weekly lead volume has been averaging 75% of pre-pandemic levels for the past 6 weeks. We’re seeing pick-up for OTB [on-the-books] corporate and association groups in August and September. Wedding room blocks are showing consistent pick-up through the summer. All group sellers are back from furlough.”
- General Manager: “The hotel is having large meetings from corporations and most of the groups are still regional. The national customer is active and looking…[and] gaining traction. Social / wedding market is very strong.”
- General Manager: “Overall group lead volume is up just over 30% to [the same period in] 2019. The overwhelming trend is for short-term business going from initial lead to operation in [just] 90 days. Lead volume for 2022 is starting to increase above normal levels. We are also seeing an ongoing trend of meeting planner…desire to pick up the full room block and then some; however, some short-term slip is occurring. This is attributed to some challenges attendees have in last minute planning and the recent surge in air prices.”
Analyzing forward booking data across a sample portfolio of leisure-oriented hotels also supports the view that group and business travel recoveries are starting to take shape. In the period from January – June 2021, Group occupancy finished at 13% of 2019 levels whereas July – December is forecasted to finish at 64% of 2019 levels. Continuing the upward trend, 2022 Group occupancy that is currently on the books is 80% of ST2Y[2]. 2023 Group occupancy is indexing at 62% vs. ST2Y[3], but our view is that 2023 is likely behind given the shortening of the group booking window, with companies currently focused on booking and rebooking cancelled events from 2020 and 2021.
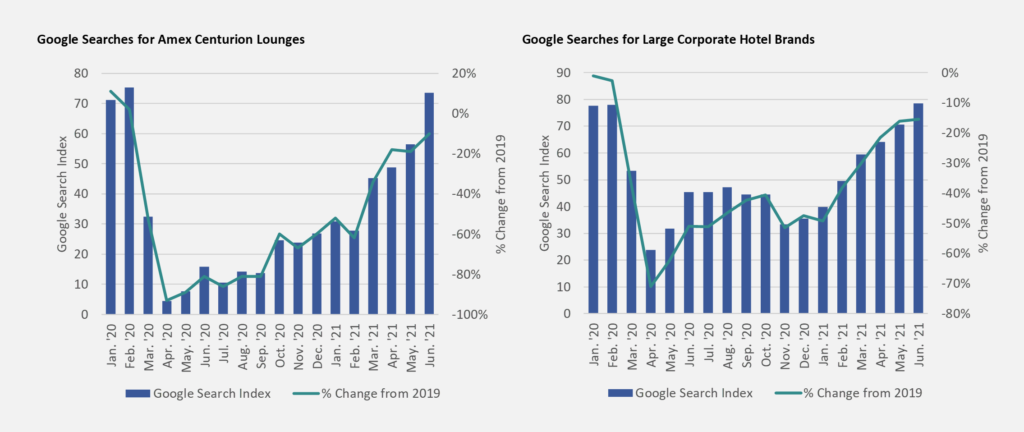
A recovery in business travel will lag the recovery in group, and carries with it a lot of questions in light of disparate return-to-office policies, international travel restrictions, and citywide convention business. But business travel is also showing signs of life, and we believe we will see an uptick in demand after Labor Day. Business travel has historically had a very short booking window and is less sticky (more prone to change / re-booking), so unlike with the group bookings described above it’s harder to leverage forward booking data for insights into business travel. However, a look at high frequency data tied to business travel, along with our recent anecdotal observation of more briefcases and laptop bags being carried around airports, suggests that we will see some uptick in business travel demand in the 3rd quarter.
The data and commentary above is just a small subset of information we’re analyzing to take a view on the group and business travel recovery. And based on what we’re seeing, we believe that we are at the leading edge of the group and business travel recovery. As mentioned multiple times throughout this update, we firmly believe that the recovery will be choppy and uneven. And ascertaining the performance trajectory within small windows of time will be made more complicated by hotel seasonality patterns and other idiosyncrasies. But we also believe that the directional path of recovery is the important dynamic to watch in this type of environment, and that directional path seems to be pointing up.
Please refer to disclaimers for important considerations.
[2] ST2Y = “Same time two years ago” – i.e. in this instance, the group occupancy that was on the books for 2020 at the same point in time (June) in 2019.
[3] ST2Y in this instance means the group occupancy that was on the books for 2021 at the same point in time in 2019.