The big picture on hospitality investing — and where we’re headed.
When we published our last letter a year ago, we highlighted two major themes driving our investment positioning at that time: (A) our belief that cap rates would continue to widen as a result of higher-for-longer interest rates and (B) our belief that the second Trump administration would be more active and cause more market volatility than a lot of market participants seemed to be pricing in.[1]
At the heart of these two themes is a big idea that often colors our investor communications and how we think about investing. That big idea is the vital importance of considering fiscal and monetary policy factors on real estate markets.[2] The notion that fiscal and monetary policies have an impact on real estate investing might sound obvious, especially to investors covering multiple asset classes. However, real estate manager decision-making and performance during the past six years suggests that many real estate managers significantly underestimate the impact. Headlines such as “Private real estate losses prompt search for answers” (PERE, May 5, 2026) reinforce our belief that fiscal and monetary policies of the macro variety have been under-accounted for as investment factors in private real estate investing. As fiscal and monetary policy tested extremes following the COVID-19 pandemic, cap rate volatility emerged as a notable driver of returns. Some of the “safest” segments of the property markets, which generally trade at lower cap rates, saw valuations whipsawed around by the rapid compression and then expansion in interest rates and cap rates. Sectors that trade at generally higher cap rates have been relatively less impacted by cap rate volatility.

Other fiscal and monetary factors that have surprised folks recently are tariffs / trade barriers and further expansion of the fiscal deficit, which is helping sustain higher-for-longer interest rates. Sprinkle in the “Tech Disruption in Real Estate” framework we have discussed in prior communications (also very much driven by fiscal policy – especially the pro-AI agenda of the current administration), and you have a recipe for risk premia and return volatility.
To be fair, there are defensible reasons why fiscal and monetary policy considerations haven’t gotten the attention they deserve during the past six years. Among them are (1) the traditional closed-end fund model, which typically puts a three-year clock on capital deployment, and (2) the widely utilized classification system for private real estate investment vehicles that can limit manager flexibility. Some of the blame likely also rests on the very nature of real estate investing and the widely held view that it’s hyper-local or “all about location, location, location” – a view that likely biases real estate investors towards thinking more in terms of localized income growth drivers at a specific point in time rather than exit cap rates five years into the future.
Coming back to the main idea, however, over our careers we’ve come to view fiscal and monetary policy factors as major forces that can amplify, and at times overwhelm, locational drivers of performance and value. We’re constantly scanning the horizon of the middle distance (2-5 years out) and thinking about fiscal and monetary policy – not trying to make calls on imminent legislation or project how many Fed rate cuts will occur in the new calendar year. These kinds of short-term calls feel futile and less relevant for investing in private illiquid assets. Instead, we’re trying to think in terms of rough probabilities, the hazy shapes of distribution charts, and general directionality.
The reasons why we might focus on fiscal and monetary policy more than some real estate managers are likely threefold: first, we’re predisposed to thinking more “macro” as a hospitality sector specialist – our catchment areas of demand are vastly larger than for an office building, retail shopping center, or apartment property. Hotels capture demand from tens, hundreds, and thousands of miles away. Consequently, considerations such as income disparities, currency exchange rates, jet fuel prices, household net worth, income tax cuts, and geopolitical “noise” are fully engrained in our analytics. Second, many of us spent formative years of our careers living (desperately hanging on?) through the 2008 Global Financial Crisis and then furiously trying to understand what the heck happened so that we could learn from it and hopefully avoid similar mistakes. Third, and most simply, we view fiscal and monetary policy as the fountainhead from which major drivers of DCF / IRR model inputs – demand, supply, and cost of capital – originate.
Real estate managers would be well-served to focus on fiscal and monetary policy in the coming years, as policies will likely continue to test extremes. The pendulum will almost certainly continue to swing back and forth with greater amplitude than pre-2020. The recent spike in energy prices and immediate resetting of expectations around 2026 Fed rate cuts is a present example. But look ahead to the horizon of the middle distance and consider what might happen with the 2028 U.S. Presidential election. What political party might be sworn in on January 20, 2029 as the next President of the United States?
As of early May, Polymarket and Kalshi prediction markets show a greater than 60% probability that the next President will be a Democrat. What are the implications for fiscal policy if that were to happen, and how might monetary policy have to react? Think about the executive order / executive action playbook established by the current administration – what might the stack of executive orders for a “Project 2029” look like? How might they address tariffs and trade? How might they address AI and data centers? What can / will the new administration do to address entitlement programs and the fiscal deficit? There’s a good chance that the playbook will create a disinflationary dynamic – what does that imply for interest rate policy?
As we sat down to write this letter, it was hard to ignore another market dynamic induced by fiscal and monetary policy that has received prominent attention recently: the K-Shaped Economy. And we thought this letter would be a good opportunity to briefly look at how the K-Shaped Economy is playing out in the hotel space, but to also reorient investors around the middle distance and why historically low supply growth of hotels might be the bigger story.
A Quick Look at the K-Shaped Economy and Hotels
First, the K-Shaped Economy[3] in the U.S. is not new. Some form of it has been a trend in the U.S. for at least three decades, driven by a steady decline in interest rates, capital markets innovations, and U.S. tax policy that have supported continued asset price growth. This dynamic has disproportionately benefited the owners of assets – homes, stocks, etc. – and U.S. household net worth grew at a 5.8% CAGR from 1990 to 2019.[4] The K-Shaped trend has been amplified since 2019 with growth in household net worth accelerating to an 8.2% CAGR from 2019-2025.
Driving the recent amplification in the K-Shaped Economy were fiscal and monetary policy decisions – too much fiscal stimulus and liquidity dumped into the economy to address COVID and base interest rates cut to 0%. And then in response to the “stubborn inflation” that followed, the Fed undertook the quickest and most aggressive interest rate hiking cycle in recent memory. Homeowners became “locked into” their homes and cheap 2021/22 mortgages, which significantly cut the inventory of for-sale housing and artificially propped up house prices. More recently, tax cuts through the OBBB tax legislation and AI-supported economic growth have propelled the dynamic further by driving gains in U.S. economic growth and the value of stock portfolios. The K-Shaped Economy has shown up in hotel data as well. Luxury hotels have outperformed non-luxury hotels by a larger margin than usual, as affluent companies and consumers have proven to be much more resilient in today’s economic environment.[5] Here’s a comparison of aggregate demand growth for luxury class hotels and non-luxury class hotels over different time periods:[6]
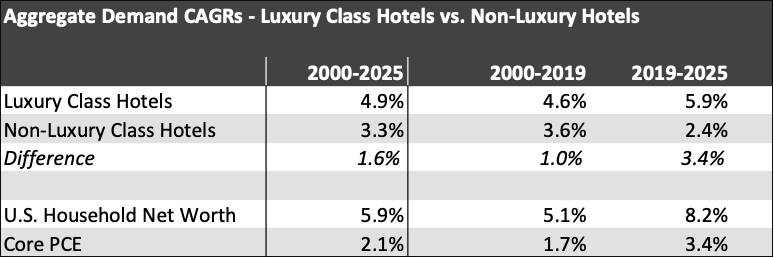
Some high-level observations: luxury class hotels have outperformed non-luxury hotels since 2000 when the dataset starts. Since 2019, aggregate demand for luxury hotels accelerated whereas aggregate demand for non-luxury hotels decelerated. Aggregate demand growth for luxury hotels exceeded Core PCE by a meaningful margin whereas non-luxury aggregate demand has grown at a slower rate than Core PCE since 2019.
It’s also worth noting that aggregate demand growth for luxury class hotels did not accelerate to the same degree as growth in household net worth. The principal reason is due to the diversified nature of luxury hotel demand across both group business (e.g., conferences, trade shows, corporate retreats, weddings, bat mitzvahs) and transient business (e.g., points redemption customers, vacation travelers, business travelers). International demand also contributes to performance. Said differently, most luxury hotels derive demand from a broad mix of business – not exclusively ultra-wealthy Americans.
Resort demand, in particular, is quite diversified. A good example would be a resort in Texas with ~500 rooms. The resort I have in mind ran at ~60% occupancy in 2025, equating to approximately 106,000 room nights occupied throughout the year. Of those 106,000 rooms, 61,000 (56% of the total) came from groups. Among the top group accounts for the resort in 2025 were: an air-conditioning and heating association; a cattle and beef related conference; a financial services group; manufacturing groups; and multiple law firms – a broad and diverse swath of companies and gatherings. Of the 45,000 transient room nights, almost 9,000 (~20% of total transient rooms) came from points redemptions – customers in the hotel chain’s loyalty system redeeming points they’ve accumulated over time. The rest were a mix of drive-to and fly-to vacation travelers and some business travel sprinkled in.
So while U.S. hotel performance at the national level has directionally mimicked the general K-Shaped Economy, it hasn’t exactly followed the same magnitude of bifurcation. Moreover, performance across specific markets and properties has been highly dispersed and significantly less harmonized than what we saw before the pandemic. Said differently, not all luxury hotels have been winners, and not all U.S. cities have seen the same post-COVID growth patterns.
Like many readers, we also wonder where the K-Shaped Economy might go from here and how to think about investment selection and underwriting against that backdrop. It’s hard to know exactly where things go from here, but fiscal and monetary policy provides some clues as to likely structural constraints and directionality.
In terms of fiscal policy, two major contributors to recent growth have been the OBBB tax legislation and the administration’s full and unconditional embrace of AI-infrastructure build-out, neither of which will likely see meaningful changes in the near-term, especially if we have a divided U.S. Congress after the mid-term elections this year. Related to the recent tax legislation is the longstanding tax policy in the U.S. that favors capital gains, does not tax loan proceeds taken out against capital gains, and even encourages the creation of new assets that can generate instantaneous wealth out of, seemingly, thin air – cryptocurrencies, NFTs, and meme stocks come to mind. Another fiscal driver is the U.S. fiscal deficit remaining elevated for the foreseeable future, keeping upward pressure on government borrowing and therefore interest rates. And somewhat related on the fiscal front is the upcoming generational wealth transfer from the Silent and Baby Boomer generations to their heirs. These generations will transfer an estimated $84 trillion through 2045, the largest wealth handoff in history, a lot of it sheltered from estate taxes.[7]
In terms of monetary policy, the Fed is confronting a tremendous amount of uncertainty, as it navigates tariffs, elevated energy prices, and stubbornly high prices across goods and services. With Kevin Warsh taking the reins, perhaps we’ll see some artificial near-term pressure to push for lower rates. But even if Warsh can convince the other voting members of the FOMC to reduce rates, prematurely lowering front-end base interest rates is likely to put even more upward pressure on long-term rates (e.g. the 10-Year UST Yield), disproportionately benefiting savers (owners of capital) and penalizing borrowers through higher mortgage rates, automobile financing costs, and generally higher inflation.
These fiscal and monetary structural constraints and forces (and lots of others that we did not have space to mention) will likely sustain an amplified version of the K-Shaped Economy in the near-term. But the medium-term is murky as we observed at the beginning of the letter with the 2028 Presidential election not far away. Fortunately, the Fed has more room today than it did in 2019 to lower rates if fiscal policy moves towards a more disinflationary posture. Nonetheless, we don’t want to bet on the amplified K-Shape continuing and, notably, we don’t have to. That’s because of another key variable in the high-end hospitality space being influenced by fiscal and monetary policy: historically low supply growth.
From 2000-2025, supply of luxury hotels grew at a ~2% CAGR.[8] That rate of growth has generally seen a deceleration each decade since the 1990s and we believe it could trend as low as 1% during the next 5-10 years, and in many markets be closer to 0%. The key reasons for the historically low supply growth are also driven by fiscal and monetary policy. Post-COVID increases in material costs, compounded by tariffs and immigration policy, have made construction of new hotels very expensive. Additionally, higher interest rates and the high cost of equity capital have made development math much more difficult, and debt and equity capital markets remain relatively risk-off for new hotel construction.
Let’s double click on why this supply growth variable is so hugely important to understand and how it interacts with aggregate demand growth to drive hotel performance. Growth in market-wide room revenue per available room (“RevPAR”) is roughly equal to aggregate demand growth minus supply growth. So from 2000-2019, using the same national-level data set as before, the market-wide RevPAR CAGR for luxury hotels was ~2.6% (aggregate demand CAGR of 4.6% minus supply CAGR of ~2.0%). From 2019-2025 the RevPAR CAGR was ~3.5% (aggregated demand CAGR of 5.9% minus supply CAGR of 2.2%). To get back to 2000-2019 RevPAR growth in an environment with a 1% supply CAGR, we only need to believe in aggregate demand growth of 3.6% going forward, a 100bps decline from the 2000-2019 historical trend line. By targeting assets in markets and of particular profiles that might see close to 0% supply growth in coming years, we’d only need to believe 2.6% aggregate demand growth, a 200bps decline. Any aggregate demand growth above these levels would provide substantial upside vs. our general positioning and approach to underwriting.
In summary, the diversified nature of demand for most hotels (especially resorts) and our outlook for historically low supply growth will likely buffer and support hotel performance going forward. Should the amplified K-Shaped Economy continue, it would provide meaningful upside to how we are approaching underwriting.
[1] The day we hit “Send” on our letter, Liberation Day had just been announced.
[2] Throughout this write-up, when we say “fiscal and monetary policy” we generally mean at the national level, although state and city level fiscal policies are also very relevant.
[3] The K-Shaped Economy is generally defined as the idea that there is a subset of the U.S. population that is enjoying higher incomes and growing wealth that is faring much better (the upper part of the K) and a subset of the population with lower / moderate income and little or no growing wealth that are faring worse (the lower part of the K)
[4] Board of Governors of the Federal Reserve System (US), Households; Net Worth, Level [BOGZ1FL192090005Q], retrieved from FRED, Federal Reserve Bank of St. Louis; May 3, 2026.
[5] We pointed out the front-end of this trend two years ago on our U.S. road show where we observed the emerging contrast between higher end hotel performance and lower end / select service hotel performance.
[6] Source: CoStar / STR. Luxury class hotels exclude New York City and Las Vegas due to market concentration and potential noise in the data. Non-luxury hotels includes economy, midscale, and upscale segment hotels and also excludes New York City and Las Vegas due to market concentration.
[7] Cerulli Associates, https://www.cerulli.com/press-releases/cerulli-anticipates-84-trillion-in-wealth-transfers-through-2045.
[8] CoStar / STR.