Update on Hotel Market Dynamics and Perspective on Past Demand Shocks
We hope you are staying safe, and we are sending our best wishes to you, your families, your teams, and your communities during this unprecedented situation.
In our first COVID-19 update on March 4th we mentioned that we would provide additional updates once market information had begun to coalesce to form a clearer picture of the situation. We also mentioned that we were in the process of comparing the COVID-19 impact to other contagion events and demand shocks. The primary purpose of this update letter is to provide updates on real-time hotel market dynamics, and to give a more in-depth perspective on past demand shocks that have impacted the hotel space. We have an early house view on the potential severity and duration of the current situation, and expect to refine that view in the coming weeks.
What’s happening now in the U.S. hotel sector?
In the initial days of COVID-19 hitting the U.S., the first impact felt by the hotel industry was a wave of convention and group booking cancellations. This dynamic negatively impacted major city and resort locations that have significant convention/group exposure – San Francisco, Miami, Coastal California, Phoenix, Boston, New York City, Chicago, etc. Shortly after that wave of group cancellations hotels experienced a second impact, which was a wave of business travel cancellations as companies prudently restricted or halted non-essential travel. That dynamic had a knock-on effect in the major urban centers in the aforementioned list. The third impact was leisure transient cancellations as vacationers decided it would be smarter and safer to avoid non-essential travel.
The net effect of these dynamics is that occupancy rates at many hotels have quickly gone from 70%-90% to 5%-20%. Some markets have enjoyed better occupancy rates, but the prevailing view from those owners (and us) is that their markets are lagging the rest of the U.S., and their occupancy rates will experience the same sharp declines in the next week or two.
As you can imagine, it is very challenging for a hotel to operate at 20% or less occupancy, and many hotels are now evaluating temporary closures to optimize cash flow. Some major owners of properties, such as MGM, have already announced closures. And we expect other large companies / brands to make announcements in the coming days. However, many hotels are balancing the societal and cash flow benefits of closure against trying to keep employees on payroll, and so not every hotel will shut down unless mandated to do so. We believe New York City could see 50% or more of its hotels close voluntarily as their cost structures and margins are particularly challenging.
How have capital markets responded since our last letter?
Risk is being re-rated and repriced across all asset classes and securities right now. On the public side of the hotel market, publicly traded hotel REITs have experienced sharp declines in stock prices. Host Hotels, a bellwether REIT that owns a very high-quality portfolio of high-end hotels and has a very solid balance sheet with low leverage, has traded down 45% in the past ~3 weeks (the S&P 500 has traded off ~29% in that same period). CMBS bonds (publicly traded debt) seemed slow to reprice in the secondary trading market at first, but that likely had more to do with a large bid-ask spread between sellers and buyers than a view that those bonds were somehow immune to the market volatility. As of March 16th, we have seen those bonds begin to trade off more. The CMBS channel is now closed for any new issuance of hotel loans, and lending will be pushed to balance sheet lenders and private vehicles.
However, our conversations with brokers and lenders suggests that there is NO bid for hotel loans from private lenders right now. And we have heard of lenders pulling pending loans either due to credit committee concerns or because their warehouse lenders are refusing to back-lever hotel loans. The last time we saw anything resembling this sudden evaporation in liquidity within hotel credit markets was after Lehman’s bankruptcy in 2008. Even during the most recent credit market dislocation of 2015/2016 (when we originally started our credit business to take advantage of that pricing dislocation) we did not see a wholesale contraction in liquidity – it was more of a matter of pricing. Right now, there seems to be no price where lenders will transact. In terms of private asset sales, most of the larger processes we were tracking have been pulled from the market. As mentioned previously, it’s unlikely that a buyer of an asset could find debt financing anyway.
How does this situation compare to historical demand shocks?
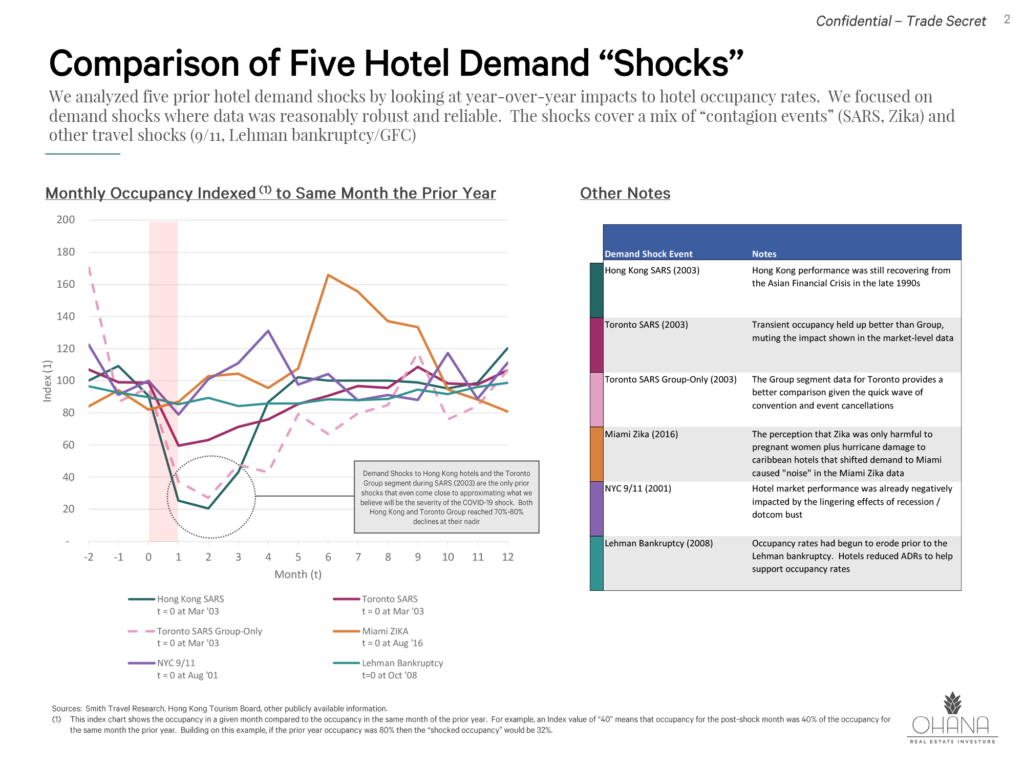
We have spent considerable time examining past hotel demand shocks stemming from contagion events (SARS, Zika) and from other macro events (9/11, Lehman bankruptcy / GFC). The accompanying supplemental slides provide further information on our analyses. Unfortunately, none of these past shocks are great guides for the current situation, and the ultimate severity and duration of this shock depend a lot on variables that we simply have no expertise to gauge such as “Is the virus seasonal and will warm weather help slow the spread?” Or “How will more aggressive social distancing and containment measures in the U.S. and around the world alter the rate of spread?” Or “Could there be a second wave of the virus?”
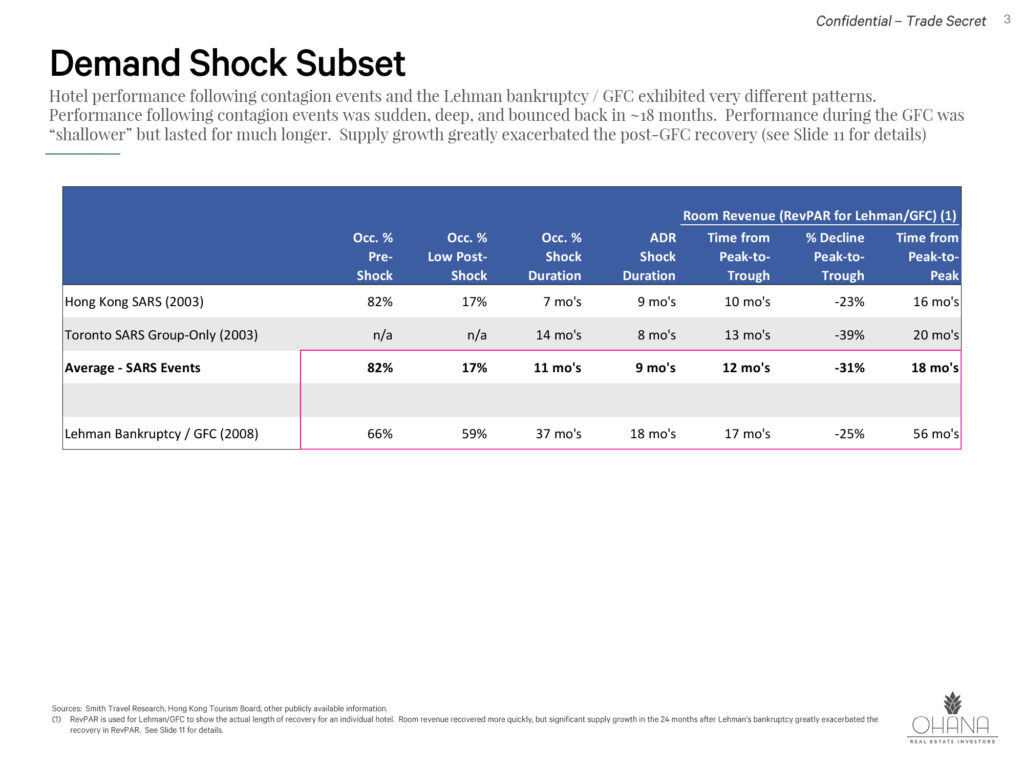
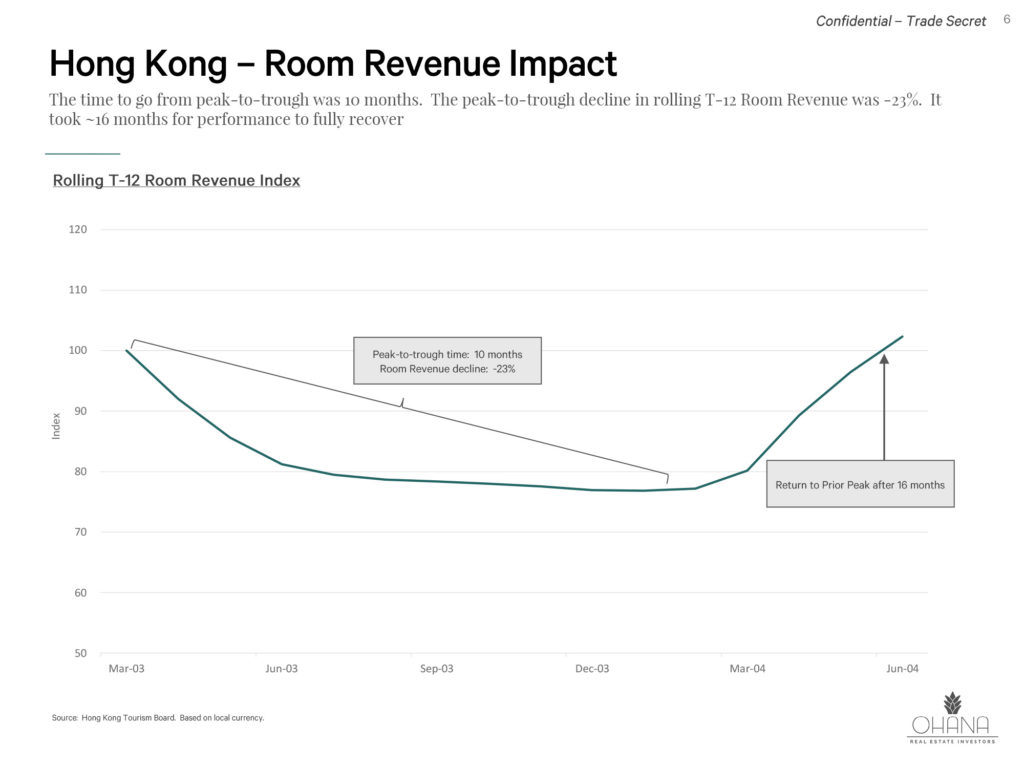
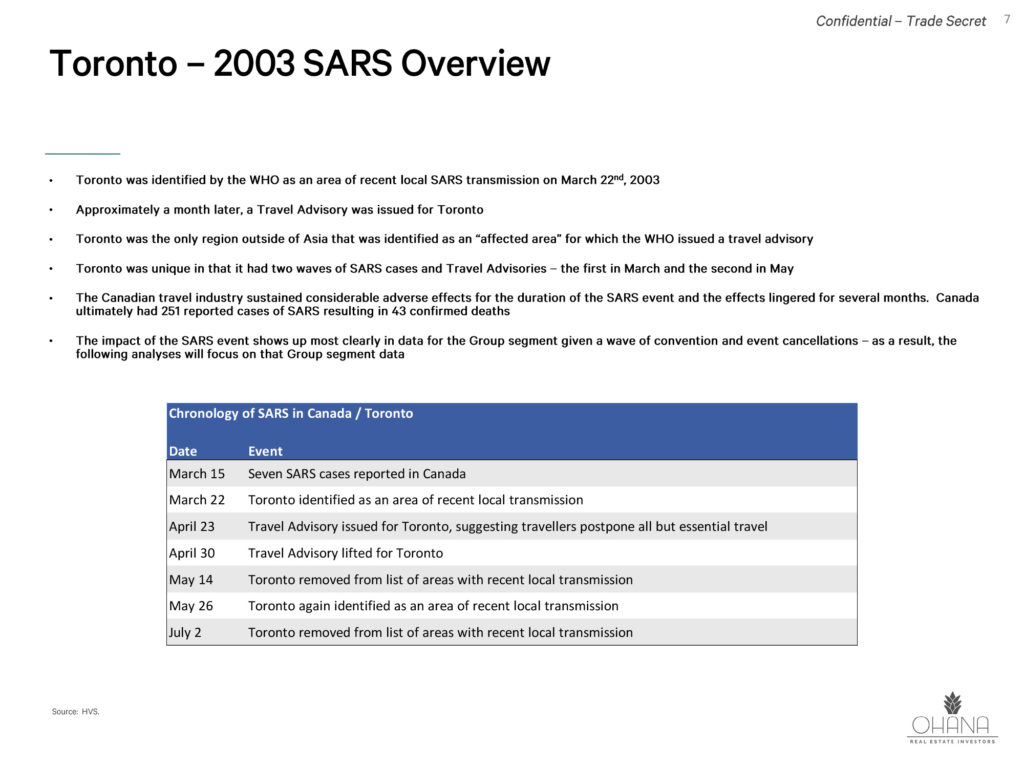
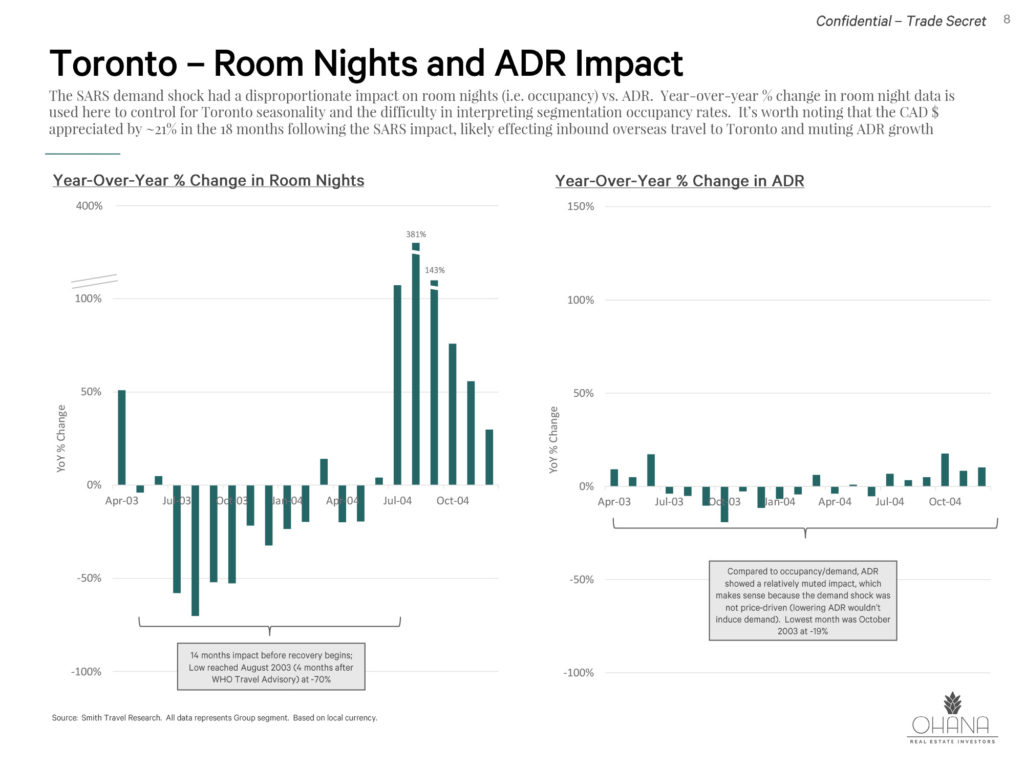
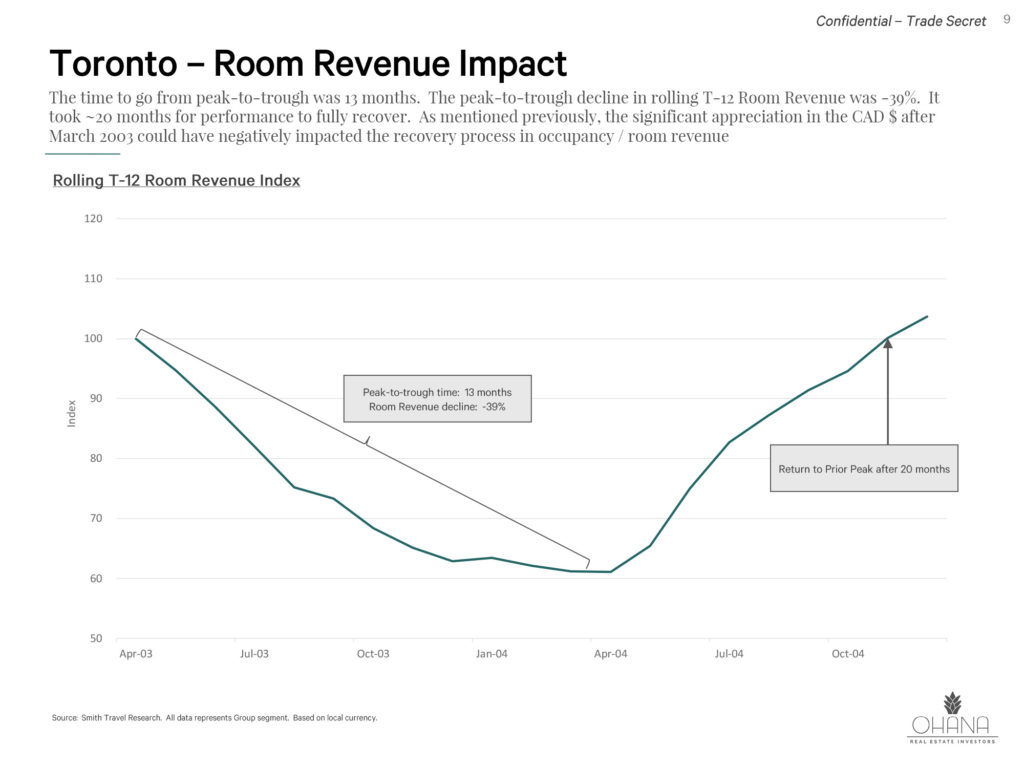
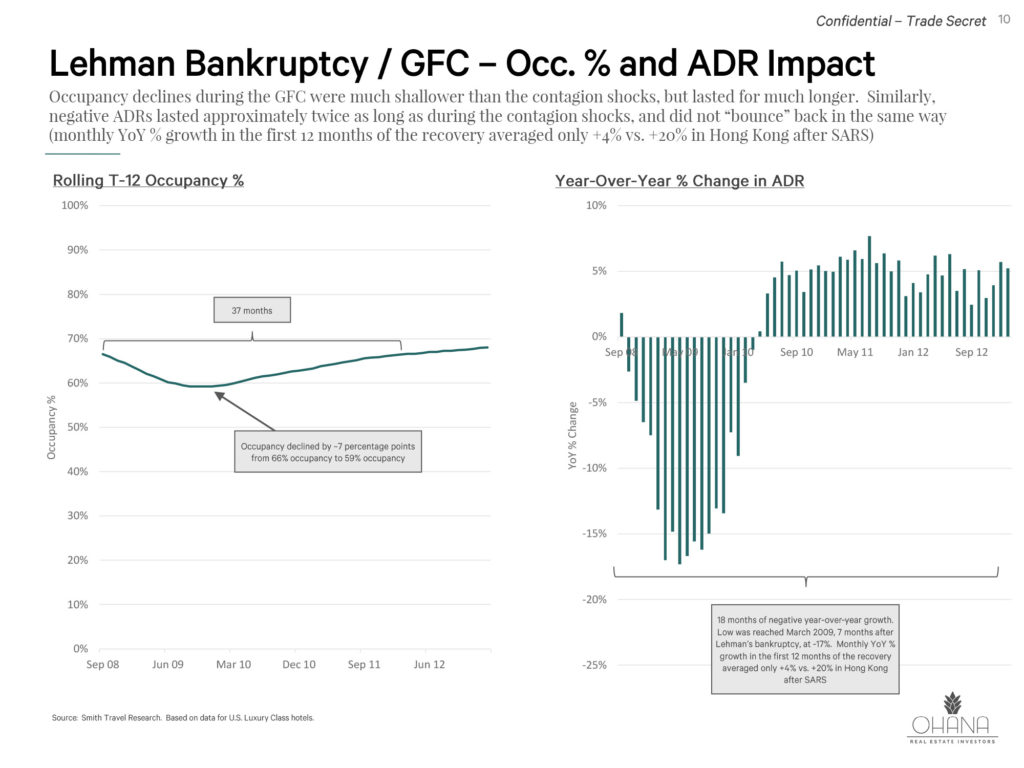
Our key take-away in studying other demand shocks is that the most representative localized contagion events, namely the 2003 SARS epidemics in Hong Kong and Toronto, have historically resulted in sharp declines in hotel occupancy rates and a return to prior peak (i.e. “normalization”) after ~18 months. This shock pattern contrasts with what we saw during the post-Lehman bankruptcy / GFC period where the downturn was relatively “shallower” but with a longer recovery time. We expect the current shock to have the sudden and sharp severity of a contagion shock (but even worse than other contagion shocks we have data on) coupled with a longer recovery period indicative of a recessionary environment (but probably not as long as the GFC recovery). The key reasons for this current view are as follows:
The SARS events are different from the current situation in two very important ways:
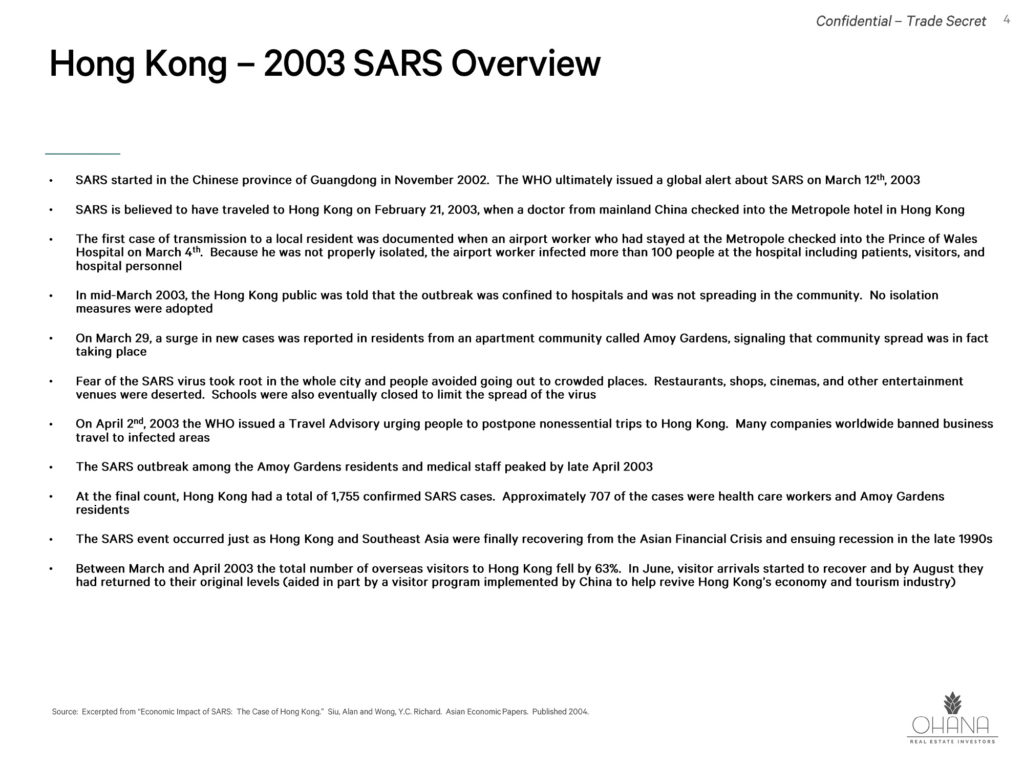
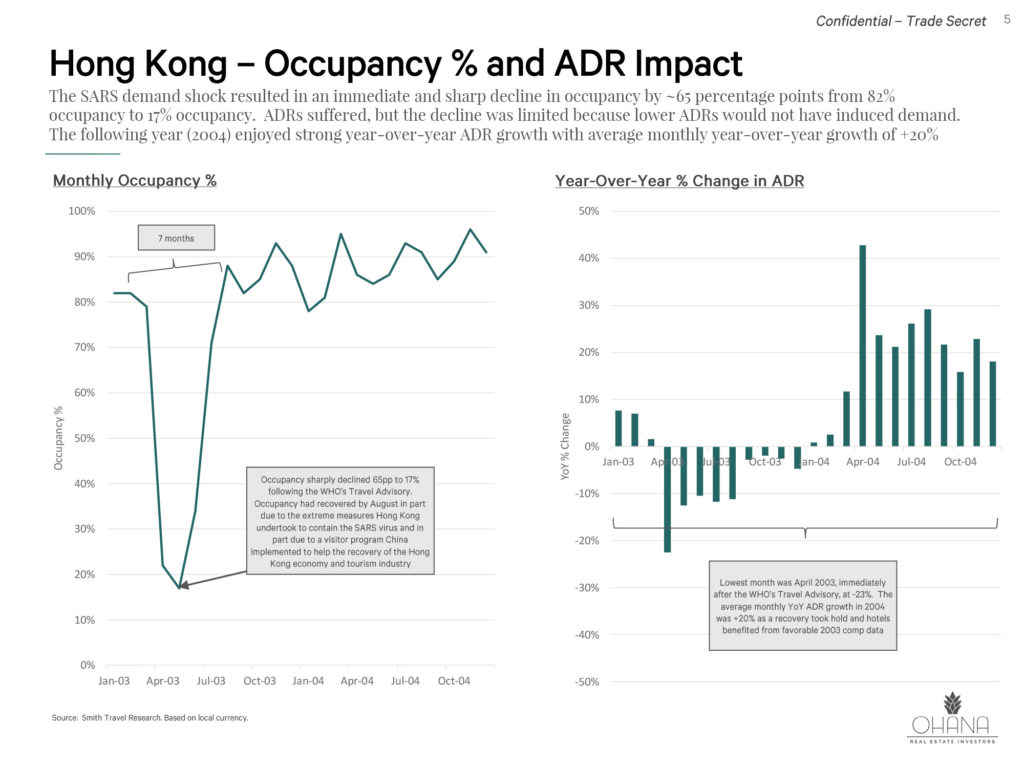
- First, the SARS virus behaved very differently from COVID-19 – once identified, it was more easily contained because individuals became infectious after several days of showing symptoms. This post-symptomatic infectiousness made it more viable to isolate patients before they became contagious and spread the virus. SARS cases in Hong Kong spiked approximately 1 month after being first reported and had dramatically slowed after 2 months, helped in part by extreme quarantine / social distancing measures implemented by the Hong Kong government. Contrasting with SARS, COVID-19 can be transmitted by asymptomatic individuals, making it far harder to contain. Carriers of the COVID-19 virus are also believed to be contagious for up to 24 days – combine that window of contagion with aggressive social distancing measures, and COVID-19 could play out for several months.
- Second, the SARS epidemics were localized events that did not result in or coincide with global economic downturns. Consequently, the local economies of Hong Kong and Toronto could lean on outside economies and visitors to help with recovery. In Hong Kong in particular, the Chinese government instituted the Individual Visit Scheme in July of 2003 (four months after the first SARS case was reported in Hong Kong) that allowed residents in mainland China to visit Hong Kong on an individual traveler visa rather than having to visit on a business travel visa or in a group tour. That outside assistance resulted in a surge in tourist visits to Hong Kong between July and November 2003. If COVID-19 continues to worsen and pushes the global economy into a recession then there might not be a healthy counterparty outside U.S. borders that can help accelerate a recovery.
The Lehman bankruptcy / GFC downturn was also different from the current situation in two important ways:
- First, the severity of the downturn was exacerbated by a pronounced contraction in liquidity in credit markets. Years of wildly imprudent use of leverage left bank, corporate, and individual balance sheets in gross disrepair. We still believe that if the direct virus impact can be confined to a 6-month window then the global economy can likely avoid a severe credit crisis, and “soften” the severity of the ultimate economic downturn.
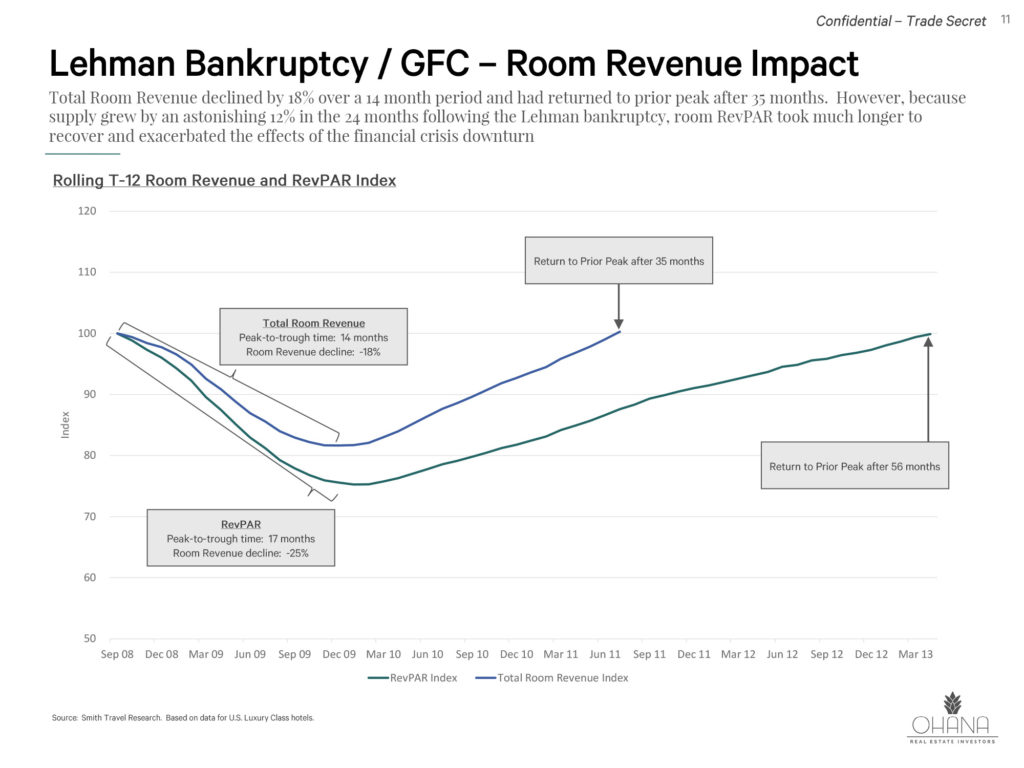
- Second, with respect to the hotel sector, the recovery period during the GFC was made longer by significant growth in supply. Hotel construction projects that were green lighted in 2007 and 2008 delivered in the months after Lehman’s bankruptcy, and the luxury segment of the market saw 12% supply growth in the 24-month period following the Lehman bankruptcy. Right now, supply growth across the U.S. is tracking at ~2.0% per year and so we don’t believe this same headwind will exist to prolong a return to normalization. However, we are mindful of certain markets being higher supply markets than others, as we have detailed in our some of our prior investor correspondence.
Our Base Case House View at This Time: As of right now our base case assumes the direct virus impact in the U.S. lasts ~6-9 months. Based on that assumption, our base case house view at this time is that rolling T-12 hotel revenue and cash flow will trough ~12 months[1] from now and that the return to prior-peak could take ~18 months after that – so 30 months total duration to get back to prior peak and “normalize”. We have read reports that the virus impact could last far longer in the absence of a viable vaccine being developed. A longer duration would obviously change our view on the duration of the peak-to-peak recovery period. This timeline could also vary greatly by sub-market and may change depending on how different factors evolve. We are still formulating our view on the magnitude of the decline, but as mentioned previously we are taking a conservative outlook on near-term fundamentals. As mentioned at the beginning of this letter, we expect to refine this house view in the coming weeks as more details emerge.
Please refer to disclaimers for important considerations.
[1] Note that rolling T-12 revenue and cash flow trough represents the point at which year-over-year monthly growth turns positive – leading up to the trough we expect to see noticeable improvements in on-the-ground performance. We expect the shape of this downturn to be front-end weighted with the worst performance skewed towards the early months with weak but far less severe monthly performance approaching the trough.