A deep dive into market data and trends as travel patterns emerge
Market Update
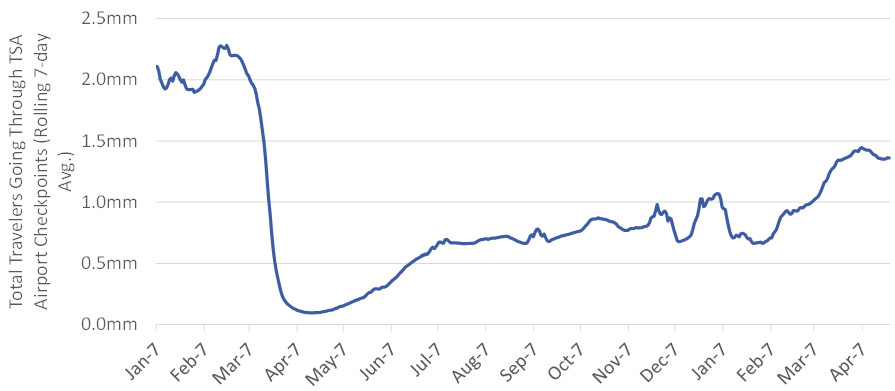
In our last update we alluded to the “green shoots” we were starting to see in March. Much of the evidence at that time was still anecdotal, as the hotel market remains uneven and performance continues to vary by market, sub-location, and property. By now a lot of us have seen some variation on the chart below: TSA Traveler Throughput – i.e. the number of airline passengers passing through U.S. airport security checkpoints. As you can see, March and April saw a large uptick in absolute Traveler Throughput coinciding with spring break in the U.S. For those of you outside the U.S., state-to-state travel within the continental U.S. has been fairly easy and seamless – travelers do not need to show vaccination cards or COVID tests to enter / exit a state. And it’s clear from our team’s recent trips that airports are much busier now than they were prior to March 2021.
Total TSA Traveler Throughput (Rolling 7-Day Average)
Unfortunately, the data provided by the TSA is aggregate U.S. data, and so it doesn’t provide a clear picture of where all of these people are going or why. However, looking at trailing 28-day hotel occupancy and RevPAR data across the Top 25 hotel markets, we can begin to see that Sunshine hotel markets are benefitting disproportionately relative to Urban markets. Markets in Florida, Arizona, and Texas enjoyed occupancy rates in the 60%-75% range in March compared to 35%-50% occupancy in certain major cities like Boston, Chicago, and New York. Similarly, many of the Sunshine markets seemed to hit an inflection point in hotel room RevPAR in March, with several experiencing 20%+ year-over-year growth in RevPAR. Conversely, RevPAR was down significantly year-over-year in cities such as Boston, D.C., and San Francisco.
STR Trailing 28-Day Data as of March 27, 2021

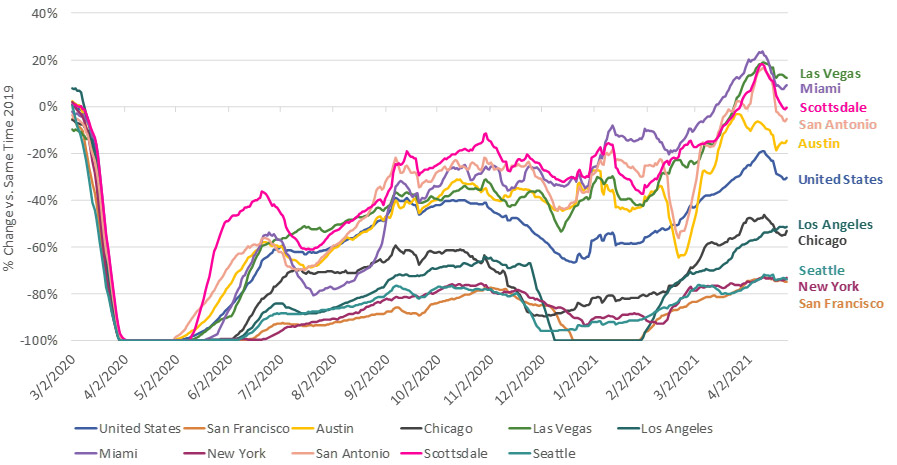
This same Sunshine vs. Urban trend can be seen in OpenTable data tracking seated dining reservation across major markets in the U.S. To spare you from having to trace all of the spaghetti lines, pay attention to the city names along the right margin of the chart. You’ll note that Las Vegas, Miami, and Scottsdale exceeded their 2019 booking levels in March and April, providing early signals of strength in consumer demand for restaurant dining as pent-up demand and fairly healthy consumer savings accounts get unlocked. This strong demand extends outside of traditional resort / leisure destinations to Sunshine markets such as San Antonio, TX and Austin, TX. These two markets have demonstrated a swift recovery helped by strong local demand and strong travel and business dynamics within the state of Texas. Falling below the United States average are major cities including Los Angeles, Chicago, Seattle, New York, and San Francisco. A lack of business travel, international travel, domestic tourism, and even local demand has hampered the recovery in these cities.
Seated Diner Data for Select Markets (Rolling 14-Day Average % Change vs. Same Time 2019)
We expect hotel and dining demand in cities to begin to rebound more this summer as businesses reopen offices and travel to coastal cities begins to return. Many U.S. companies have announced their return-to-work plans, with many having a more flexible transition leading up to Labor Day (September 6) and then having an office reopening after Labor Day. We also believe that many (not all) people who temporarily left coastal cities during the pandemic are starting to return. Additionally, city entertainment venues are starting to reopen, and many venues have announced summer sporting and concert seasons that we expect to create additional demand for hotels and dining.
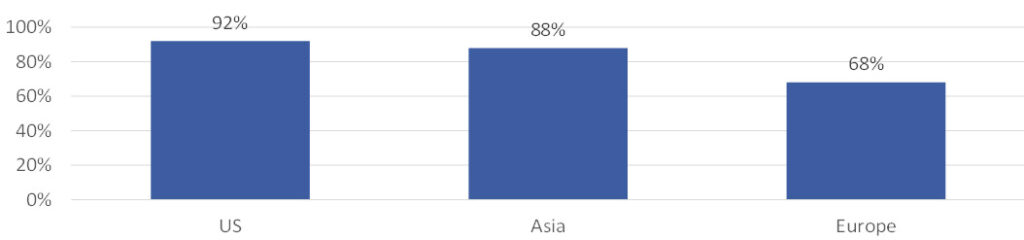
We do think that international travel will continue to lag, and U.S. markets that are highly dependent on international travel and cannot substitute it with domestic demand will take longer to recover. Europe in particular continues to struggle and experience an uneven recovery. The latest vaccination data shows that ~50% of the U.S. population has received at least one does of a COVID-19 vaccine, whereas only ~20% of the European population has received at least one dose. This disparity in vaccine roll-out is holding back a European recovery. American Express data on Q1 business billed by region shows the U.S. almost fully recovered to Q1 2019 levels (92% of 2019) whereas Europe billings came in at 68% of 2019 levels.
American Express Q1 ’21 Business Billed by Region as a % of 2019 Level
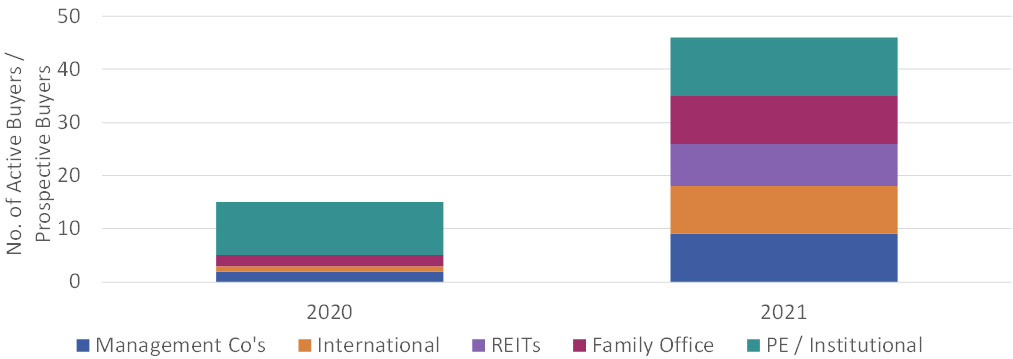
On the transaction activity front, there has been a definite uptick in the number of groups pursuing hotel transactions. We recently asked our friends at a large U.S. real estate and hotel sales brokerage firm to list the number of “real” prospective buyers for large hotels 9-12 months ago vs. today. The punchlines were: (1) the number of active buyers today is 3x vs. 9-12 months ago and (2) the field of prospective buyers is more diverse today and less dominated by a handful of firms chasing deals. Notwithstanding these dynamics and the green shoots mentioned above, the hotel sector continues to be very inefficient, and as a sector specialist with real-time data on hotel operations and debt financing markets, we continue to have an advantage over tourist investors.
Estimate of Active Hotel Buyers in the Market – 2020 (Post-COVID) vs. 2021
Conclusion
What’s apparent to us is that the situations at each property and in each market are evolving rapidly, and a lot of the anecdotal evidence we are seeing on forward bookings and group sales pipelines provide further evidence of investable trends. However, as always, we continue to be cautious in our approach to underwriting, and we continue to keep an eye on vaccine roll-out, variants, and other risks. Our frequent conversations with hotel owners, lenders, and sales brokers leads us to believe the next ~8 months of 2021 will see a pronounced uptick in transactions coming to market.
Please refer to disclaimers for important considerations.